Thematic Mapping
Thematic maps use different visualization techniques to show the assoication between a geographic area and a theme. Thematic maps are useful to help provide information about spatial patterns, and to compare locations. There are 4 types of thematic maps: choropleth, isarithmic, dot, and proportional symbol maps.
Choropleth Map

Obesity has grown to become a risk factor for many chronic
diseases in the United States. This choropleth map shows the prevalence of
obesity in the United States for each state in 2008. A choropleth map is a useful
tool that aggregates data by geographical areas. It improves communication
between public health professionals and the public by using a simple visualizing
technique with different colors and/or shading that represents the statistical data
for the topic analyzed. In this map the variation in shading and colors
represent the prevalence of obesity in each state based on the statistical
information gathered by the National Center for chronic Disease and Health
Promotion. The lighter colors and shading indicate a low prevalence of obesity,
while the darker shading represents high prevalence rates for obesity.
Isarithmic maps

Isarithmic maps are contour maps that contain
continuous and smooth phenomenon using isolines that represent constant values
over geographic areas. This map is an isarithmic map that indicates
hydrogen ion concentration from field laboratories in 1998.
Dot Density Map

A dot distribution map uses dots to represent the presence
of a phenomenon in a geographic area. Dot maps create a visual impression of
density and should be used to represent raw data. The dots on this map indicate
the amount of tobacco produced in each state. In this map 1 dot represents
1,000,000 pounds of tobacco grown.
Proportional Symbol Map
 |
A proportional symbol uses symbols of different sizes to represent
data relative to that location. This map shows the number of lynchings for each
state from 1882-1968. The size of the symbols depends on the number of
lynchings found in that state. This information is useful for formulating
corresponding death rates in the United States.
Environmental Sensitivity Index Map
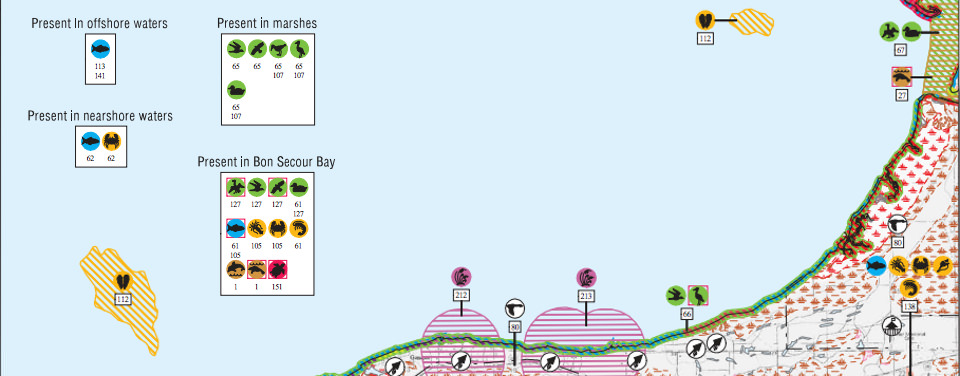
Environmental Sensitivity Index (ESI) Map shows a compilation of coastal
resources at risk for an oil spill. The information provided allows public
health professionals to plan cleanup strategies before an accident occurs and
save natural resources. Shoreline are color coded to show their sensitivity to to oiling. The back of most ESI maps have tables
showing when species are present in the areas shown on the front of the maps and
indicate their seasonality, breeding times, and threatened/endangered status.
References:
Heer, J. (2010, May 23). A Tour through the Visualization Zoo . Retrieved from ACMQUEUE: http://queue.acm.org/detail.cfm?id=1805128
Heer, J. (2010, May 23). A Tour through the Visualization Zoo . Retrieved from ACMQUEUE: http://queue.acm.org/detail.cfm?id=1805128
Marzulli, F. N. (1942). THE EFFECTS OF HYDROGEN ION
CONCENTRATION UPON THE METAMORPHIC PATTERN OF THYROXIN- AND IODINE-TREATED
TADPOLES. Journal of General Physiology, 623-647.
National Oceanic and Atmospheric Adminstration.
(2014). What is an environmental sensitivity index map? Retrieved from
National Oceanic and Atmospheric Adminstration: United States Department of
Commerce: http://oceanservice.noaa.gov/facts/esimap.html
No comments:
Post a Comment